CMSIS-DAP with openOCD, external Jlink or openSDA Jlink firmware.
CMSIS-DAP is still in a development, according to the site cmsis-dap: add initial cmsis-dap support [openocd.zylin.com]. Thus I went straight to Jlink's options. The last option is the most useful for many users. I will describe to process how to set it and be able to debug your KL25Z with no external parts needed.
1. step - download Jlink firmware
Visit a webpage SEGGER openSDA Jlink [http://www.segger.com], there are links on the bottom of the webpage. Be aware of some limitations which are stated there.
Download OpenSDA Jlink firmware http://www.segger.com/admin/uploads/userfiles/file/J-Link/JLink_OpenSDA.zip
2. step - get serial number of openSDA
Switch your KL25Z to the bootloader mode (unconnect usb, hold reset button, plug it back in while holding button, release button). Copy there unzipped file JLink_OpenSDA.sda
Restart the board, then plug it back to your PC.
In case you don't have installed jlink software (gdb, jlink console). Get this program from here which will display the serial number of your openSDA jlink in order to download the jlink software (you need jlink's serial number which we obviously don't know as we don't have external tool).
3. step - install JLink software
Download Jlink firmware here JLink software [http://www.segger.com]
This will install Jlink configurator, check serial number, type it in the page pasted above and download jlink software.
After installing jlink software, navigate to a jlink's folder in my case c:\Program Files\Segger\JLinkARM_V472a, open JLink.exe program. It will display this warning, check the below button, it won't display today, and press accept.
This should be an output if your board is connected and the jlink driver was installed properly:
4. step - run jlink gdb server
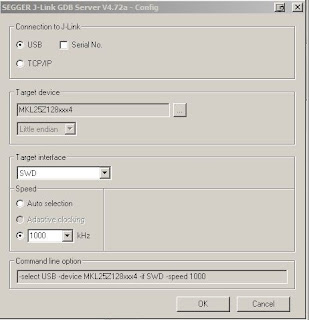
The program is located again in the Segger Jlink software folder, named JLinkGDBServer. Execute the program, it pops the config window, set it as it is shown on the picture:
Press OK and it should display the following lines
As you see, it's connected to my freedom board. Keep it running, we will connect to it once we complete debug settings in Eclipse.
5. step - set eclipse project
Before going further, your eclipse must have installed GDB Hardware Debugging plugin. If not, please find a tutorial how to install that plugin.
Open your mbed KL25Z project, select your project, click on the green bug (the top right corner on the picture) and select Debug configuration.
Click with your right mouse button on GDB Hardware Debugging, create New one
On the bottom of the window it is "Using GDB (DSF) Hardware .... Select other . Click on select other and we need to check button Use configuration specific and select Standard GDB Hardware
Now we are back in Debug configurations, select Debugger tab and fill details according to the picture below
The first input window (Initialization Commands) contain on my side the following commands
target remote localhost:2331
monitor clrbp
monitor endian little
monitor speed 1000
monitor reset
monitor sleep 100
monitor speed auto
The last input window (Run Commands) (Note: I prefer to put a breakpoint in Reset_Handler)
break main
continue
I assume your jlink gdb server is running, click on the debug icon on the bottom of Debug configurations window.
This should be your window (breakpoint is set in main, thus it stops there).
Now led should be blinking.
The debugging part over ! There are tutorials how to work with gdb. If anything not correct, please use comments below or contact me on mbed. I'll add this to my notepad there.


